Control: What Drives Discounts for Interests in Real Estate Holding Companies?
By Sadikshya Karki, Supervisor, Advisory Services

Valuing an asset holding company requires careful evaluation, and there are special considerations for real estate holding companies in particular. To value asset holding companies, an analyst must determine the appropriate discounts that are applicable based on the particular characteristics of the entity and the subject ownership interest. In this article, we will explore discounts for lack of control that are often applicable to non-controlling interests in holding companies that own real estate.
What is control and when is a discount warranted?
Elements of control include the ability to control financial, operational and legal aspects of a business. This control can include selling a business or all of its assets. Generally, control significantly increases the value of an investment.
A discount for lack of control is warranted when determining the fair market value1 of an ownership interest that does not unilaterally control these key aspects of the business (i.e. a non-controlling interest). To determine discounts for lack of control applicable to real estate holding companies, experts often rely on the Survey of Re-Sale Discounts published by Partnership Profiles Inc. (PPI)2. This annual survey reports the discounts from net asset value (NAV)3 at which non-controlling interests in non-publicly traded real estate limited partnerships and real estate investment trusts (REITs) have been purchased in the secondary market.
NAVs of these secondary market partnerships reflect the value of real property owned by the partnership that has been determined by an independent appraiser or estimated internally. Discounts (or premiums) can then be determined by comparing the actual trading prices of non-controlling ownership units in that entity to the pro rata NAV per ownership unit in that entity.
What drives discounts?
There are several factors that tend to increase or decrease the discounts from pro rata NAV at which the non-controlling interests trade.
Holding Period
For real estate holding entities, the holding period is the assumed period of time before an entity is expected to liquidate (sell its asset and distribute proceeds). Non-publicly traded partnership and REIT interests are priced to reflect expectations of the time period until the program is liquidated. This is especially true for programs that don’t make distributions and are not expected to do so in the future (or make distributions that are low relative to the NAV).
Studies published by PPI indicate that partnerships and REITs that have announced definitive liquidation plans trade at lower-than-average discounts. Discounts reduce even further for such partnerships that make regular operating distributions because investors would still be receiving distributions even if plans for liquidation fall apart or get delayed. Programs that usually do not make cash distributions until underlying assets are sold (e.g. undeveloped land) are typically priced at a higher discount.
In summary, investors in non-controlling interests command lower discounts for lack of control once liquidation plans have been announced, and they are relatively short term.
But what about entities that have not yet announced liquidation planning? PPI states that the two most important factors considered by secondary market buyers when pricing units of real estate programs that have not announced a definitive liquidation plan are:
- the program’s ability to pay operating cash distributions and recent history of actually paying such distributions, and
- the degree of debt financing, if any, utilized by the program.
Let’s examine how these two factors affect discounts.
Distributions
Data published by PPI from 2012 through 2022 shows that an entity’s ability to pay operating cash distributions has the biggest influence on discounts: the higher the distributions, the lower the discount. The reported yield-to-NAV and yield-to-price ratios reveal a strong negative correlation with discounts. The correlation coefficients of the discounts based on three elements are as presented below:
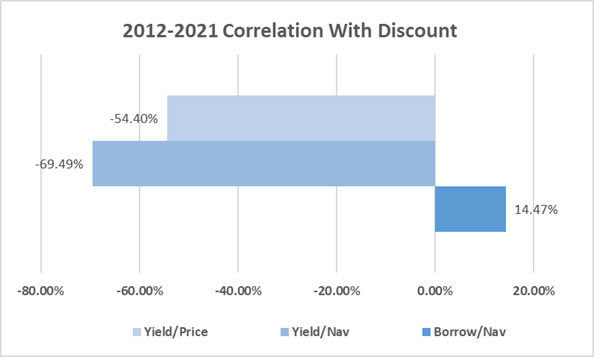
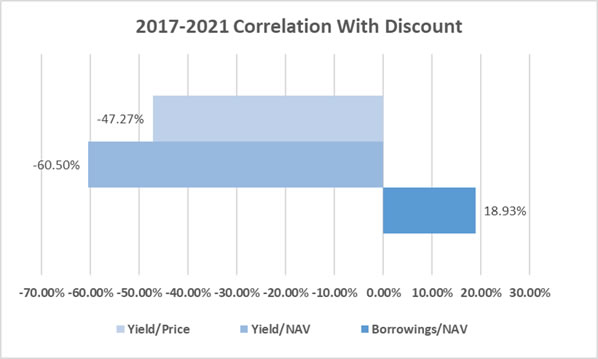
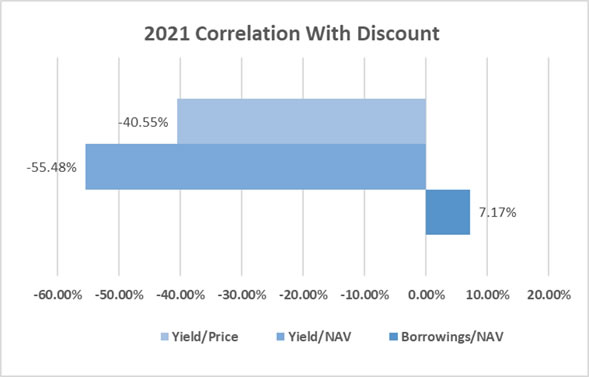
This indicates that the most significant influence on the discounts is the yield, not the extent of debt. The following two charts demonstrate the same comparison but for more recent time periods.
Degree of Debt Financing
Historically, distributing partnerships with moderate to high debt (75% or more) traded at higher discounts than those with minimal to no debt—the higher the debt, the higher the discount. However, PPI data indicates that this gap between discounts for varying levels of debt has changed since 2015, as presented below:
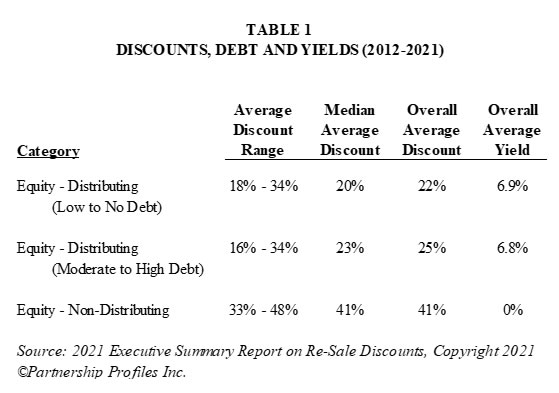
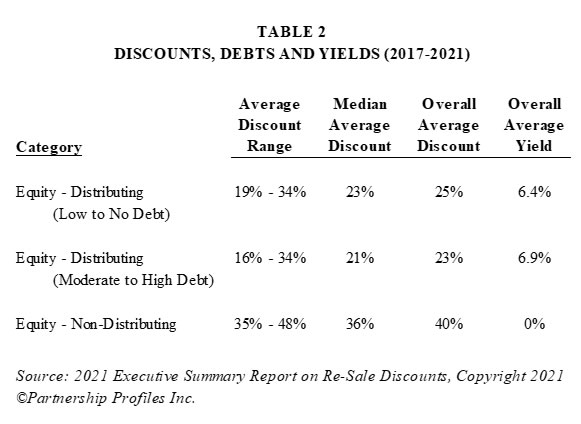
Notice that for the period 2012-2021, in Table 1, average discounts for the ‘low to no debt’ category are lower than those in the ‘moderate to high debt’ category.
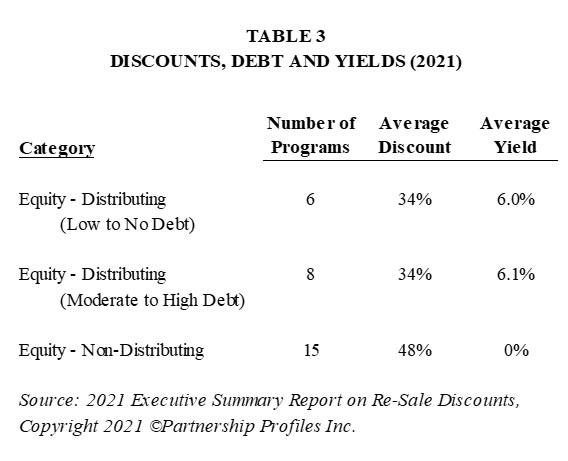
In the 2017-2021 period however, the average discounts for these two categories have reversed regarding which one is higher (Table 2). Examining solely 2021 in Table 3, the average discounts for the two debt categories are the same. These tables also show the sizable difference between the distributing and non-distributing entities (the influence of yield).
Does program type affect discounts?
Different real estate holding entities have different types of investment structures and underlying assets. Discounts are typically higher for riskier programs. Three types of programs are summarized below to compare their underlying assets, risk profiles and average discounts.
| Program Type | Triple Net Lease | Mortgages | Undeveloped Land4 |
|---|---|---|---|
| Description | Pursuant to long-term lease agreements: lessees are obligated to pay all insurance, taxes and day-to-day maintenance expenses associated with such properties. No active management of properties. Investors may receive immediate returns in the form of rent payments. |
Programs that invest in commercial real estate debt. Debt consists of primarily floating-rate mortgage loans secured by various property types. |
Programs that invest in undeveloped land. Does not generate operating cash distributions. |
| Comparative Risk Profile | LOW | MEDIUM | HIGH |
| Average Discount (2015-2021)5 | 19.71% | 25.57% | 35%6 |
How did the COVID-19 Pandemic impact discounts?
The COVID-19 pandemic had tremendous economic effects worldwide, and continues to affect many areas of the economy, including real estate holding entities. PPI reported relatively higher discounts in 2020 and 2021, as summarized below:
| Survey Year | Average Price-to-Value Discount |
|---|---|
| 2012 | 32% |
| 2013 | 31% |
| 2014 | 28% |
| 2015 | 22% |
| 2016 | 20% |
| 2017 | 19% |
| 2018 | 19% |
| 2019 | 23% |
| 2020 | 33% |
| 2021 | 38% |
The higher discounts in 2020 and 2021 can be partially attributed to the longer anticipated liquidation periods resulting from the uncertainty caused by the pandemic. Another factor affecting discounts in 2020 and 2021 was the higher number of non-distributing partnerships (which usually trade at the highest discounts) in those years—many of these partnerships did not make cash distributions at all due to the negative impact of the pandemic on their operations.
Real Estate Holding Entities and Control
In summary, while discounts may have increased due to the pandemic, and while debt may have been a greater consideration in the past, the most important factor affecting discounts for lack of control for real estate holding entities are its distributions. As PPI emphasizes, distributions and debt are important, but a more nuanced understanding of those two factors helps the savvy analyst better value entities that hold real property.
Sources & Footnotes
- Appendix B of the Statement on Standards for Valuation Services (copyright 2015 by the American Institute of Certified Public Accountants defines fair market value as “The price, expressed in terms of cash equivalents, at which property would change hands between a hypothetical willing and able buyer and a hypothetical willing and able seller, acting at arm’s length in an open and unrestricted market, when neither is under compulsion to buy or sell and when both have reasonable knowledge of the relevant facts.” This definition is generally considered synonymous with definitions used for gift, estate, and other tax setting.
- 2021 Executive Summary Report on Re-Sale Discounts, Copyright 2021 ©Partnership Profiles Inc.
- NAV is the market value of the assets less liabilities.
- There were no programs owning strictly undeveloped land in PPI’s 2021 survey. These programs have become more rare over the years due to liquidations; the 2015 through 2017 surveys featured only one undeveloped land program.
- Latest year available.
- Average includes 2015 through 2017.
2021 Executive Summary Report on Re-Sale Discounts, Copyright 2021 ©Partnership Profiles Inc.


