The Global Market Portfolio
By Michael McKeown, CFA, CPA, Chief Investment Officer, Marcum Wealth

Every few years, authors of the Financial Analysts Journal update a version of the global multi-asset market portfolio. It considers the total market value of investable assets in the world. I made some tweaks since the article seems to understate some large asset classes like private equity and real estate. This provides a framework for analyzing where your portfolio weights compare to a passive version of the world.
Even Nobel Prize winner William Sharpe stated that he “cannot easily understand why funds do not routinely compare their asset allocation with current market proportions.”
We will start with the big picture. The total value of investable assets is $179 TRILLION, yes with a “T.” Of that, public equities make up $66 trillion, fixed income securities $93 trillion, real estate $17 trillion, and private equity/venture capital at $3 trillion. All figures are estimated as of the year-end 2015.
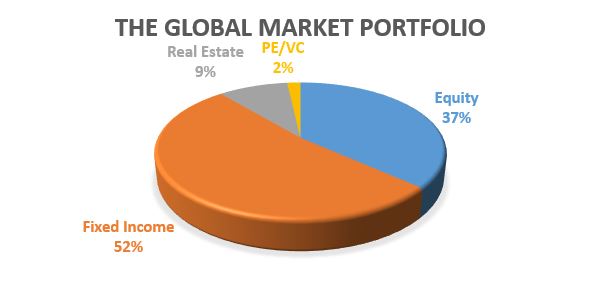
For my purposes, I excluded hedge funds as these are a vehicle to mainly access equity, fixed income, and derivative securities. At a quite relevant $2.7 trillion, the argument can be made for inclusion, but this would result in double counting a large portion of assets since actual holdings are largely traditional equities and bonds, with leverage. I also excluded commodities because historically this “asset class” provides a 0% real return with massive volatility (which is worse than cash, over time). I went back and forth on excluding the $6.6 trillion of negative yielding global bonds as well, but kept them since perhaps one day the yields will be positive and investable again.
Below we have a breakdown of each asset class with regions and sub-asset classes.
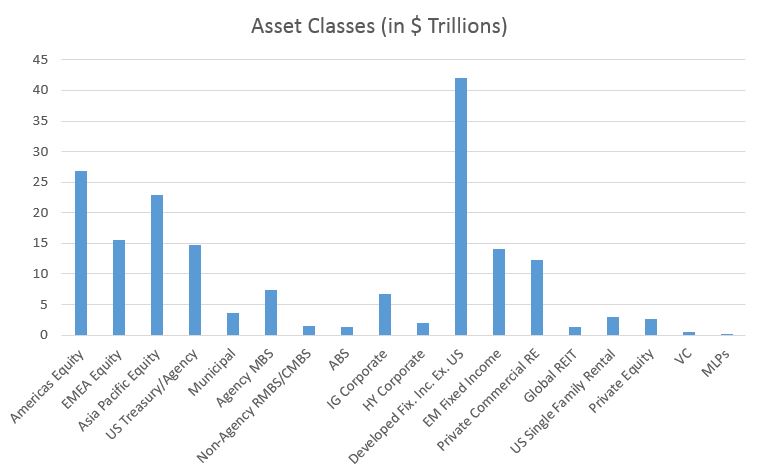
The U.S. is still the biggest public equity market, but with Japan and China so large, the Asia Pacific Region is larger than the EMEA region (Europe, Middle East, & Africa). The surprising items from going through this exercise was how much developed market debt there is outside of the U.S. It is the largest asset class and sadly the yields are mostly below 2%. I also was surprised at the size of the U.S. single family rental market, which is an emerging asset class for institutions. The measly size of private equity was interesting considering all of the media attention.
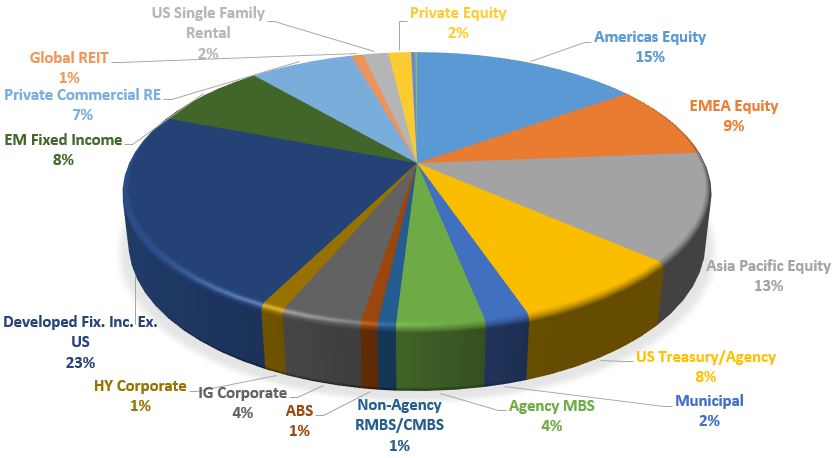
Here is a look at the values above but presented in proportion to one another as the next level look of the Global Market Portfolio.
Whether an individual or institutional investor, one’s asset allocation will have some difference to the Global Market Portfolio. The time horizon, liabilities, overall objectives, and risk tolerances all play a factor on whether the right design is overweight equity and underweight fixed income, for example. Still, it serves as a gauge of where one falls on the spectrum for areas such as Mortgage Backed Securities (MBS) or Investment Grade Corporate bonds.
We think of having more than a benchmark as being “overweight” an asset and less than a benchmark as being “underweight.” Arguably, the most common overweight positions for external portfolios we review are in U.S. Equity (14% of Global Market Portfolio), U.S. High Yield Corporate bonds (1%), and MLPs (0.2%).
The most common underweights are to a few areas which I do not mind, since the foreign currency exposure would be too costly to hedge. This includes developed market fixed income and emerging market fixed income (though a modest allocation is surely appropriate). Most also tend to be underweight real estate (since one’s home rarely is cash flow positive even if it is paid off, I cannot classify this as an “investment). In addition, most hold an underweight to foreign equities (both developed and emerging, which make up 23% of investable assets).
Where does your portfolio stand relative to the Global Market Portfolio?
Sources: Securities Industry and Financial Markets Association, World Federation of Exchanges 2015 Report, Norway Sovereign Wealth Fund Real Estate Study 2015, Prequin, JPMorgan Guide to the Markets, Morgan Stanley Research
This material is based on public information as of the specified date, and may be stale thereafter. Marcum Wealth and/or Marcum Advisory Services has no obligation to provide updated information on the securities or information mentioned herein. Actual events may differ from those assumed and changes to any assumptions may have a material impact on any projections or estimates.


