The Road Ahead: Dental Practice Strategies for 2023
By Angela Pratt, RDH, Senior Manager, Advisory Services

As the year ends, wise and proactive dental practice owners are setting aside time to diligently reflect on 2022 and build their vision for 2023. The importance of identifying the “wins” of your practice will serve as positive foundation in your road map into the new year. However, identifying growth opportunities in 2023, coupled with insight into current industry trends, just might help you win the race.
The United States Dental Services Market size was estimated at USD 47.16 billion in 2021, USD 50.42 billion in 2022, and is projected to grow at a Compound Annual Growth Rate (CAGR) of 7.32% to reach USD 72.09 billion by 2027.1 At the same time, due to advancements in dental technology and treatment modalities, the patient experience will start to look far different from what your team and patient base are conditioned to expect.
After 30-plus years in the dental profession, I’ve discovered that dentists are far better at learning and implementing the newest gadget than they are at successfully identifying and responding to consumer/patient behavior shifts that drive a practice’s profitability and future.
So, how do we begin to design our approach for 2023? With the cost of living at the forefront of consumers’ minds and interest rates increasing, patients will likely look to spend less — including on their dental health.
Consider the adages, “Without a plan, plan to fail,” and “Where to start when you don’t know where to start.” Proactive practice owners who identify baselines in their KPIs (key performance indicators) sooner than later may discover specific growth opportunities, which will help them intentionally prepare their team to achieve said goals.
Most clients prioritize or focus primarily on production and collection numbers. As important as these are, understanding other important KPIs which are driving these two numbers proves to cause deliberate action and recovery. In other words, not just knowing the number, but how you did or did not meet your benchmark serves the client on a much higher level.
In my experience, clients often fail to understand how they are or are not achieving practice/team goals. In recent years COVID has been the scapegoat, with little attention paid to some of the big factors affecting team performance and patient response. So, when you sit down with pen and paper to make your plan, consider emphasizing these practice operational areas to move your team forward in 2023.
1. Number of New Patients (Net) New Patient Count
Solo practice benchmark: 20-25 new patients per month — that’s net new patients. If you’re currently only tracking new patients coming into the practice and not tracking your attrition activity (including specific patient reasons), your perception of progress toward your net new patients goal is skewed.
More importantly, recording the specific reason a patient decides to leave provides your team with opportunities to improve patient retention. Given the external stresses patients are facing, it’s vital we become stronger listeners to better understand why the patient isn’t moving forward. We cannot fix what we do not know.
2. Treatment Conversion Ratio (TCR): Amount Accepted/Presented
Do you know the minimum dollar amount of treatment to be presented? See a basic math example below.
Minimal Bottom Line:
35-50% average accept treatment
$100k collected to cover all fixed/variable expenses
HYGIENE produces 30% on average= $30k
RESTORATIVE to produce $70,000
Bottom $ amount to present?
35% acceptance – minimally must present $200,000
50% acceptance – minimally must present $140,000
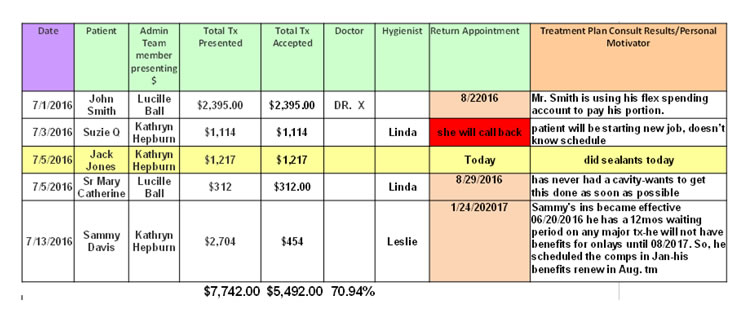
How effective is the team in diagnosing, educating, presenting financial options, and ultimately convincing the patient to say yes? The table above provides a picture outside of most practice software systems. Utilizing other methods of tracking and monitoring, not relying on stock dental practice management software reports, allows the practice owner and team to see how effective the treatment plan coordinator and the hygienist are at promoting your treatment philosophy. Additionally, you can see where the team can record personal “connection” comments to help assist individualized follow up dialogue.
Patients today accept and are impressed by new technology and its ability to educate them about their level of health. It’s important to consider what technology is available and whether you are consistently utilizing it to optimize ROI. Here are the tech-driven trends we see in dentistry:
- Smart toothbrushes.
- 3-D printers.
- Augmented reality.
- Intra-oral cameras.
- Tele dentistry.
Once the practice has the up to date technology, it’s important to evaluate your team’s ability to use the equipment. Successful implementation will help the team work more efficiently and provide an updated, patient-friendly, and educational environment for patients to better understand your recommendations.
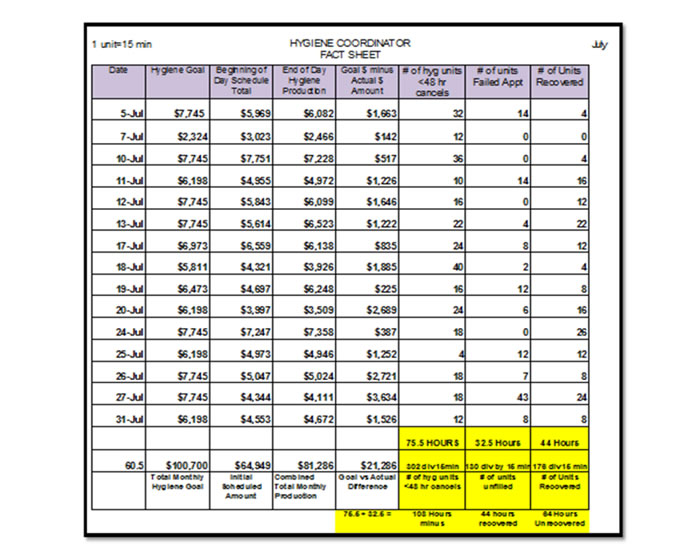
3. Number of Failed/No-Show and Short Notice Appointments in Hygiene
This example focuses only on the hygiene appointment aspect of the practice. Given the industry-wide challenge of simply keeping the patient population healthy when trying to recover from the pandemic, an empty chair monumentally destroys any hope of achieving practice production goals. Given that we are also dealing with a shortage of dental hygienists which reduces patient care availability, short notice (48 hours or less) cancellations, and the forbidden no call/no-shows prevent patients from being seen at the recommended intervals.
Let’s look at an alarming basic statistic on failed appointment/no-shows or short-notice cancellations:
Gross average hygiene appointment fee: $260
$260 x 1 per day x 4 per week x 50 weeks: $4,333 per month and a whopping $52,000 per year in lost revenue.
This example reflects only one missed or failed appointment per day. Can you imagine what it would look like with two hygienists per day?
Establishing clear production goals with both administrative and hygiene accountability shows just how proactive each of these departments are toward scheduling and recovery. The table illustrates this very expensive challenge and shows its impact on your practice’s financial picture.
This method of tracking and monitoring the results assists the practice owner in communicating production expectations, reveals initial re-appointment efforts, and administrative attentiveness to adverse schedule changes. It also provides hygiene production percentages and the responsiveness of recovery. All are vital aspects of conquering just one of the major challenges in day-to-day practice.
In conclusion, we know there are many factors that affect overall practice health. The KPIs discussed today are simply a few of the less expensive disciplines to consider. Your online marketing, social media, and patient convenience aspects also require attention. Let these reminders help you develop attainable goals for your team and provide additional profits to cover other operational expenses.
Sources
- Business Wire (2022). U.S. Dental Services Market 2022: Forecast & Market Share Analysis Examines the $50 Billion Market – Dublin – (May 2022) https://www.researchandmarkets.com/reports/5455679/dental-services-market-research-report


